

The GSIP Toolkit are currently under development and is not final.
Feedback may be submitted at the bottom of each page.

Data Analysis & Processing
The process and methods for evaluating and interpreting the data collected to identify operational and safety needs and to inform an organization/domain’s response.
Introduction
Translating large, complex sets of data into meaningful, actionable results, can be quite challenging. This may require an organization to condition data, apply advanced analytical techniques, or to depict results in innovative ways. Advanced models and data visualizations are one way to improve effective cross-organizational safety enhancements. Data Analysis & Processing aims to provide stakeholders with increased awareness of tools, resources, methods, and processes to improve the identification of:
Safety event trends and patterns
Cross-cutting causal factors impacting performance
Recurring human errors
Emerging operational safety risks
Effective safety enhancement initiatives
Data Analysis Types
There are many different types of safety analyses utilized across the aviation industry. Some analysis techniques are easily adoptable utilizing the safety data already being collected by most organizations. Other more advanced analysis techniques may require new or modified data collection mechanisms. Provided below are example analysis types that may each provide unique insights to an aviation analyst.
Frequency-based Analysis

Many safety analyses begin with frequency-based assessments of safety data. Summarizing the most frequently occurring hazards or safety event types provides an organization with a way to rank and prioritize safety issues. For example, an air carrier may track and monitor the number of high energy landings across different airports, approaches, or aircraft types. Analysts can then monitor high energy landing events across their operation and identify reoccurring patterns and trends. Results of frequency-based assessments will typically lead to ranked listings of top hazards and the identification of prioritized issues that require further analysis.


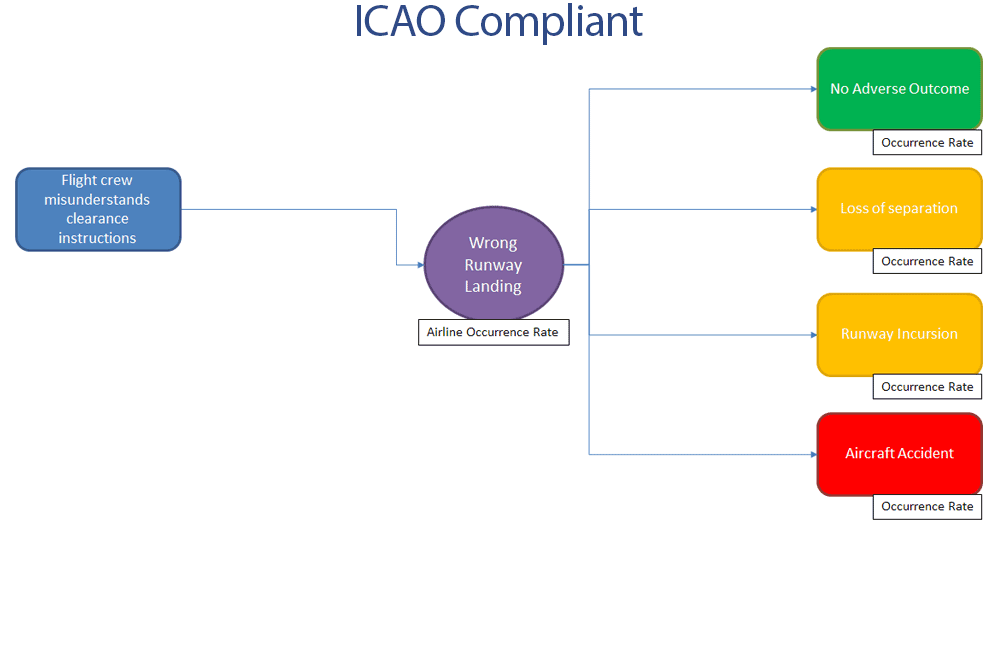
Bowtie Analysis

A Bowtie analysis is a method that enables analysts to graphically document the risks and barriers associated with hazards and adverse events. Central to the bowtie diagram is a Top Event that represents the outcome of a hazard facing a system, such as a Wrong Runway Landing l Expanding to the left of the Top Event are the series of Threats that could lead to the occurrence of the Top Event. Expanding to the right of the Top Event are the various Consequences resulting from the Top Event, such as runway incursion. Supplementing the Threats and Consequences are the Control and Recovery Barriers that reduce the impact of the Threats and minimize the Consequences of those Barriers.
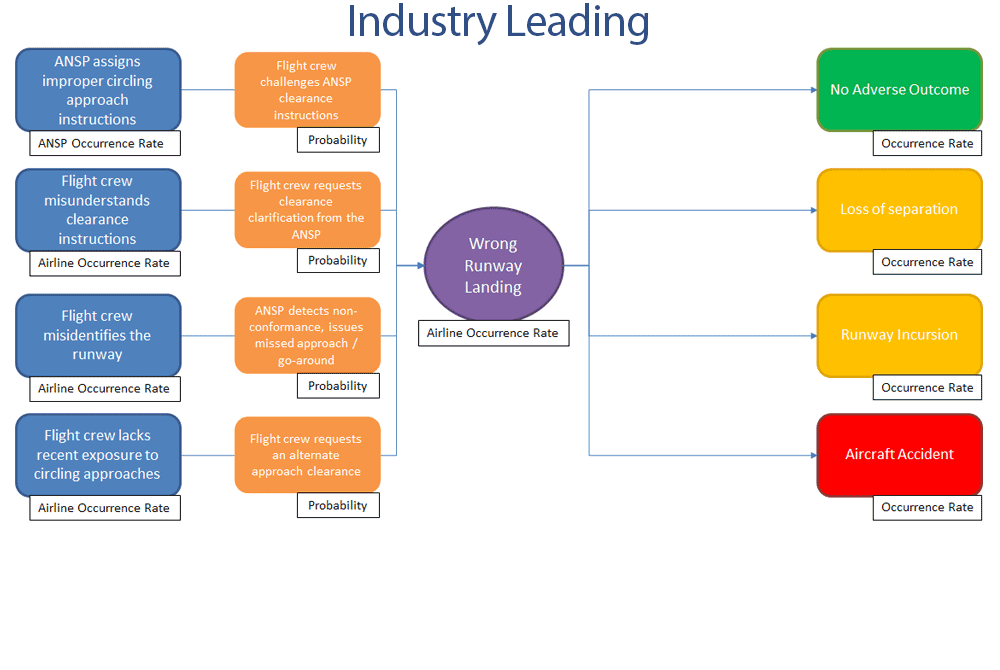
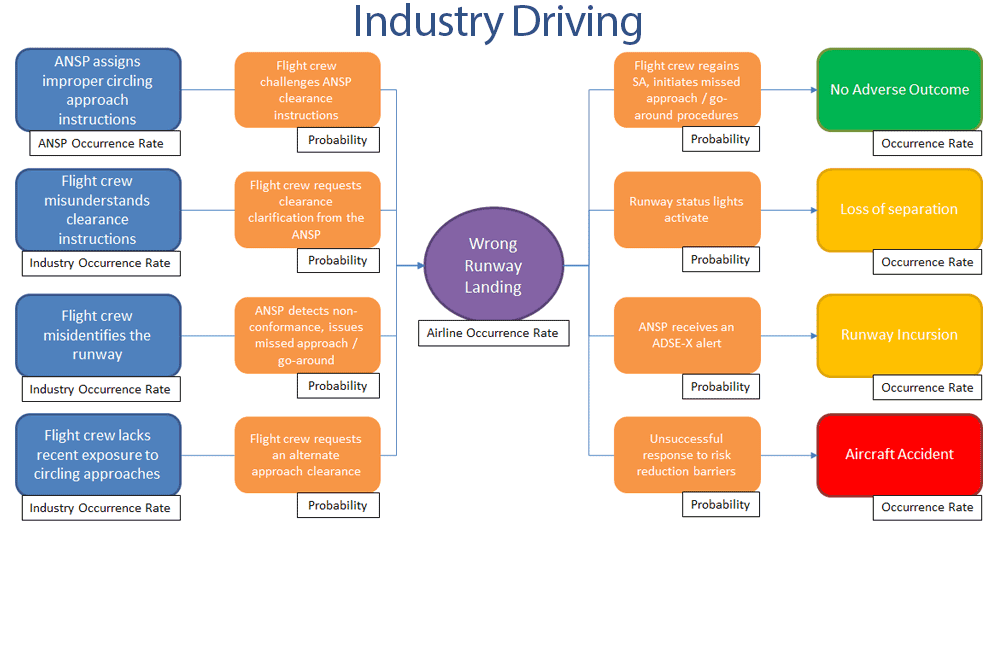
The primary benefits of a Bowtie analysis are the ability to visualize multiple plausible scenarios in single place. More advanced Bowtie applications may include probabilities and rates to support advanced safety modeling applications. Industry driving bowtie analyses typically include multiple types of threats from different domains and stakeholders.


2D & 3D Hotspot Analysis

Hotspot Analysis provides a way to visualize safety data that includes a 2D or 3D geographic component to support proactive risk assessment. Typically Hotspots are identified by highlighting the overlapping, or most frequently occurring, geographic data elements. For example, an airport operator, regulator, or ANSP may plot all runway incursions at a given airport onto an airport diagram. The areas with the most frequently occurring runway incursions may then be highlighted and designated as surface hotspots. The information can then be utilized to enhance pilot and air traffic controller situation awareness related to improving runway safety. More advanced Hotspot analyses may utilize Flight Data Monitoring to develop 3D Hotspots highlighting geographic regions with the most frequently occurring TCAS Resolution Advisories or Ground Proximity Warnings.


Causal Factor Analysis

Accidents, incidents, and other safety events rarely occur in isolation. In many cases, the resulting safety event is the result of a series of causal and contributory factors that influenced the resulting safety event. A Causal Factors analysis aims to identify, classify, analyze, and mitigate the presence of factors adversely impacting safe operations.
Most Causal Factor analyses begin with the development or modification of a causal factor taxonomy that outlines the latent and active factors present in a domain. The taxonomy can then be used to inform the collection of safety data from employee voluntary safety reports, safety investigations, and safety assurance data. At the more advanced safety analysis levels, trend analyses can be conducted to identify and prioritize the factors that introduce negative and positive impacts to operational safety.


Comparative Analysis

Organizations interested in maintaining consistent performance improvement may engage in Comparative Analyses. Comparative Analysis, also known as benchmark analysis, involves the direct or indirect comparison of operational performance against comparable safety data sets. Comparisons may be made either internally against a company's historical performance or externally against a comparable set of industry performance data. Comparing operational safety data against other performance data enables an organization to identify irregularities and opportunities for improvement. External comparative analysis requires access to related data through data exchanges or pooled data sets. More advanced comparative analysis can be utilized to facilitate industry-wide focused safety improvement workshops and improvement initiatives.


Data Analysis & Processing Levels
An organization may choose the level of intensity appropriate for analyzing operational safety based on the organization's capabilities and the significance of the hazard being assessed. Additionally, the levels of intensity allow an organization to identify opportunities to enhance data analysis & processing techniques and effectiveness to support thorough and accurate analyses and products.
| ICAO Compliant | Advanced Measures | Industry Leading | Industry Driving |
|---|---|---|---|
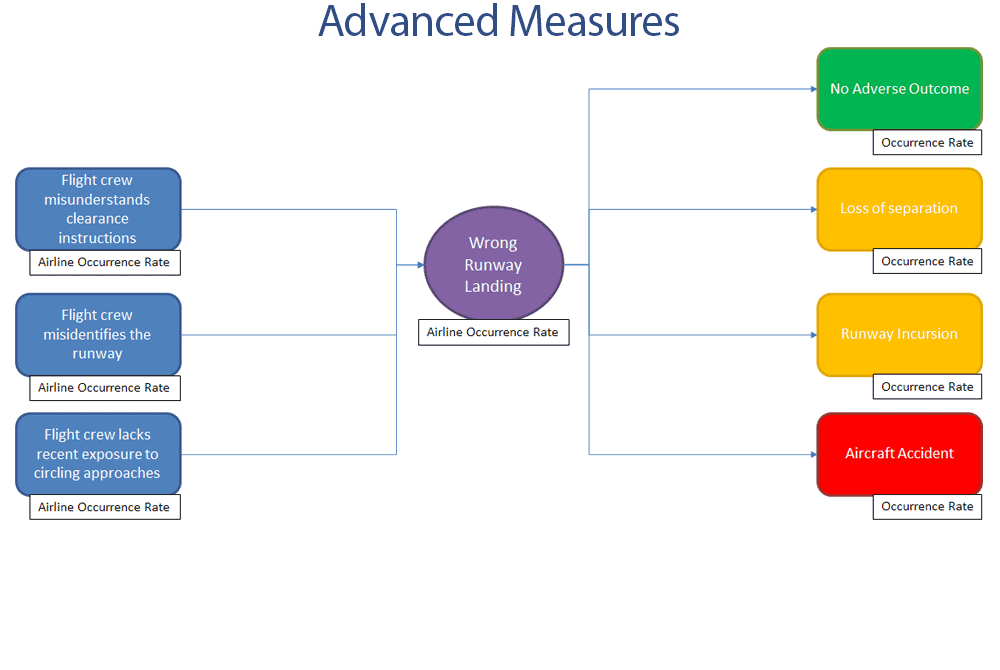
| Data is assessed against the notion of a single specific hazard and whether risk is above acceptable levels—mitigation assignments are made. | Data is analyzed to understand all direct hazards and their impact on undesired outcomes. Multiple hazards are each examined for their influence on risk. | Data is analyzed to understand all direct and indirect hazards and their impact on undesired outcomes. Multiple hazards are each examined for their influence on risk. | Data is analyzed to understand all industry impacts on safety. Multiple hazards are each examined for their influence on risk. Multiple organizations are contributing analysis to the risk assessment. |
Data Analysis Assumptions
All capabilities are independent of each other
Sources of data include: Public Safety Data, Reportable Occurrences, Safety Program Information
Domain capabilities are additive to the preceding domain capabilities (e.g., Industry Leading Capabilities assumes achievement of Minimum Compliance and Advanced Measures)
Example Application
The example below demonstrates the increasing levels of intensity applied to an analysis of the risk of wrong runway landings.
Resources and Examples
A collection of resources related to aviation data analysis and processing are provided below. Click any example for more information.


Feedback Requested
The Flight Safety Foundation requests your feedback will help us achieve one of the core objectives of GSIP – improve the sharing and harmonization of information. All aviation safety stakeholders are invited to submit toolkit feedback via either the link below or by adding a comment to this page. All feedback will be reviewed by the GSIP team to improve the overall quality of the product.